By Michael Grass
During a May 4 keynote presentation at a virtual conference hosted by the George Washington University Institute for Data, Democracy & Politics, Kate Starbird, a University of Washington Center for an Informed Public cofounder and Human Centered Design & Engineering associate professor, discussed “the notion of participatory disinformation that connects the behaviors of political elites, media figures, grassroots activists, and online audiences to the violence at the Capitol,” as Justin Hendrix of Tech Policy Press wrote in a May 13 analysis of Starbird’s research.
But what exactly is participatory disinformation, how does it work and what does it look like?
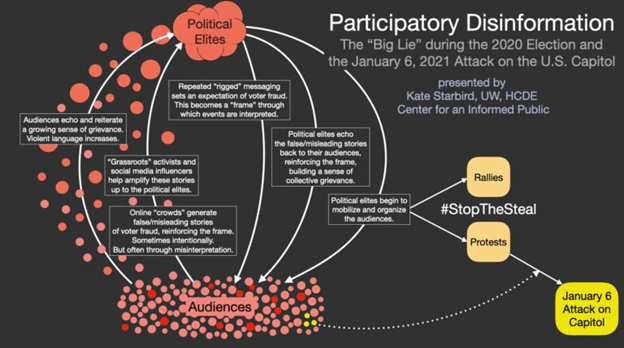
In a May 6 tweet thread, Starbird shared a series of infographics she created as part of her work at the Center for an Informed Public that helps illustrate the conditions that allow participatory disinformation to take root and can lead to something like the insurrection at the U.S. Capitol on Jan. 6, 2021.
“The diagram represents a starting point for discussing the various entities and forces — each in conversation with the other — that make up the broader participatory effort that is the Big Lie, and how it took advantage of social media affordances and dynamics,” Hendrix wrote of Starbird’s work.
Starbird’s tweet thread was featured in an explainer analysis, “The chain between Trump’s misinformation and violent anger remains unbroken,” by The Washington Post’s Philip Bump and also by Eli Sanders in his Wild West tech policy newsletter.
In a long-form May 21 Washington Post feature by Dan Zak that examined the controversial vote audit in Maricopa County, Arizona, Zak spotlighted Starbird’s tweet thread and research on the dynamics that shape disinformation.
“It was clarifying to read more about disinformation, which is designed to ‘reduce human agency by overwhelming our capacity to make sense of info.’ I can’t judge whether that’s happening in Maricopa, but it certainly *felt* like this. It spins your head,” Zak wrote in a tweet thread, citing a 2019 paper, “Disinformation as Collaborative Work: Surfacing the Participatory Nature of Strategic Information Operations,” written by Starbird and two of her PhD students, Ahmer Arif (now an assistant professor at the University of Texas at Austin) and Tom Wilson (who in April published his dissertation, a mixed-method, multi-platform analysis of the online disinformation campaign targeting White Helmet volunteers during the Syrian Civil War).
Starbird’s May 6, 2021 tweet thread and visuals that lay out key dynamics that shape participatory disinformation are reproduced below …
***
Participatory disinformation tweet thread by University of Washington Center for an Informed Public co-founder and Human Centered Design & Engineering associate professor Kate Starbird, May 6, 2021
- Working on some visuals to help explain the dynamics of “participatory disinformation” and how that motivated the January 6 attacks on the U.S. Capitol.
- Let’s start from the beginning.
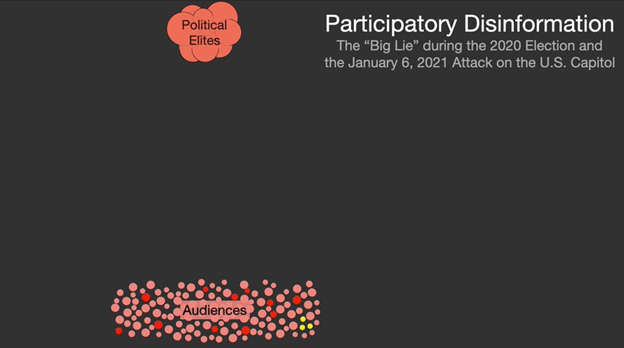
- We have “elites,” including elected political leaders, political pundits and partisan media outlets, as well as social media influencers who have used disinformation and other tactics to gain reputation and grow large audiences online.
- We also have their audiences — the social media users and cable news watchers who tune into — and engage with — their content.
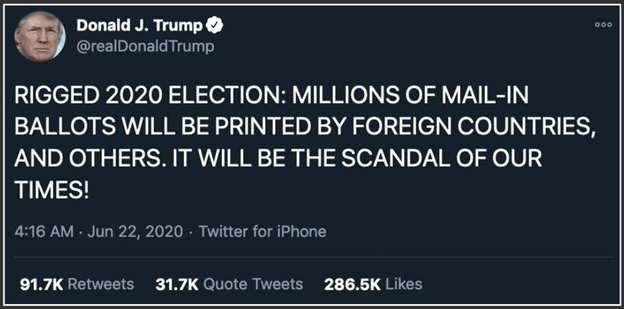
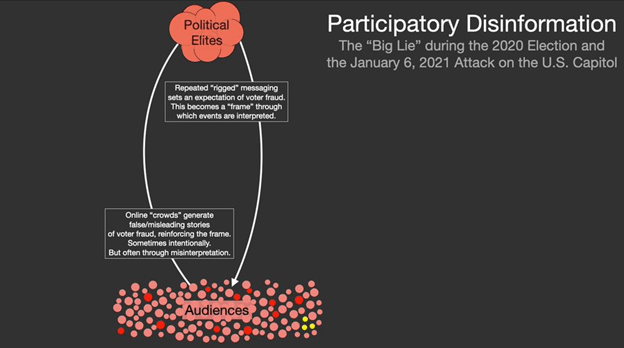
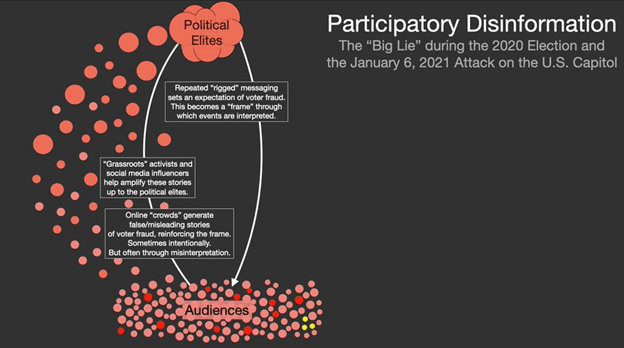
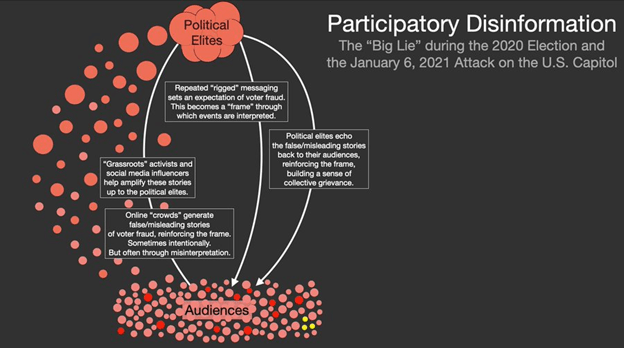
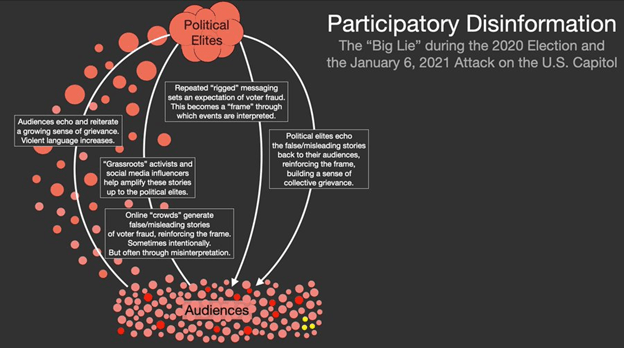
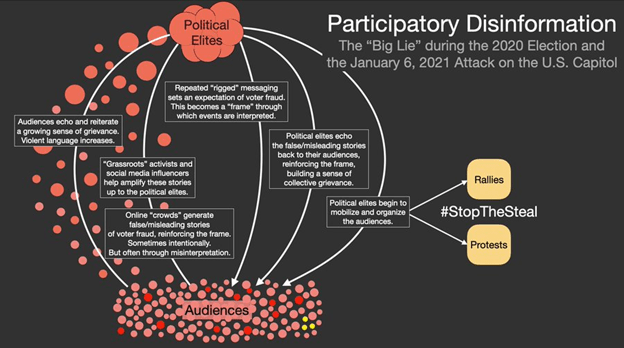
- During the lead-up to — and for several months after — the 2020 election, political elites on the “right” (Trump supporters) repeatedly spread the message of a rigged election. This set an expectation of voter fraud and became a “frame” through which events were interpreted.
- An example of one of those messages is this one, from @realDonaldTrump, in June 2020:
- With their perspective on the world shaped by this frame, the online “crowds” generated false/misleading stories of voter fraud, echoing & reinforcing the frame. Sometimes these stories were produced intentionally, but often they were generated sincerely, misinterpreted.
- We see this w/ the #SharpieGate narrative, as people were initially concerned about Sharpie pens bleeding through (which would not have affected their votes in most cases), and later became convinced that the pens had been an intentional effort to disenfranchise Trump voters.
- “Grassroots” activists and social media influencers helped amplify these stories, passing the content up to the political elites. Some intentionally attempt to “trade up” their content to reach larger influencers (w/ bigger audiences).
- Political elites then echo the false/misleading stories back to their audiences, reinforcing the frame, and building a sense of collective grievance. Shared grievance is a powerful political force. It can activate people to vote — and to take other political action in the world.
- Audiences echo and reiterate this growing sense of grievance. Violent language and calls to action increase.
- Political elites began to mobilize and organize the audiences into a series of rallies and protests (under the #StopTheSteal hashtag which began on Election Day and began to encompass a number of false and misleading narratives about voter fraud).
- And on January 6, the protests — motivated by this participatory disinformation dynamic — turned violent, in an attempt (by people who, at least in part, falsely believed they were patriots defending their country from a stolen election).
- Participatory disinformation makes for a powerful dynamic. These tight feedback loops between “elites” and their audiences (facilitated by social media) seem to make the system more responsive — and possibly more powerful and unwieldy.
- Responding to a comment here, one aspect of this dynamic is that it can produce new “elites” who manage to use the system to gain reputation (and followers).
- My understanding of the dynamics of online misinfo & populist political movements is informed by Ong & Cabañes work on “networked disinformation” in the Philippines. (My class read that paper this week.) Seems to apply to many contexts around the world.
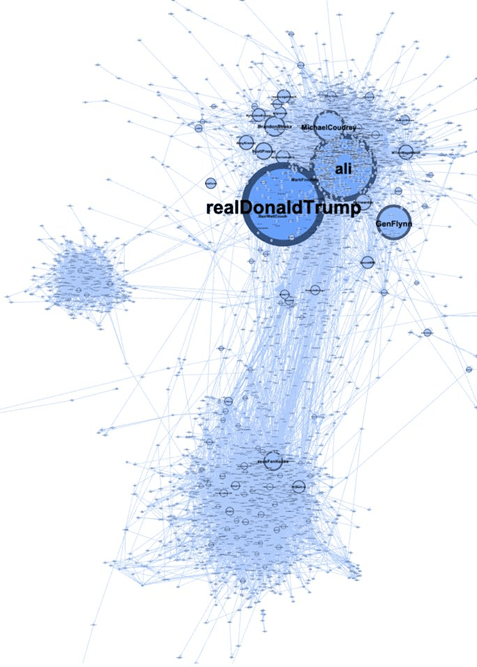
- A sparse view of the retweet network of “Stop the Steal” tweets (edges = 10 RTs by one account of another), so only shows common trajectories of information flow gives a sense of who the “elites” where in this discourse (on Twitter, they may differ on FB and elsewhere).
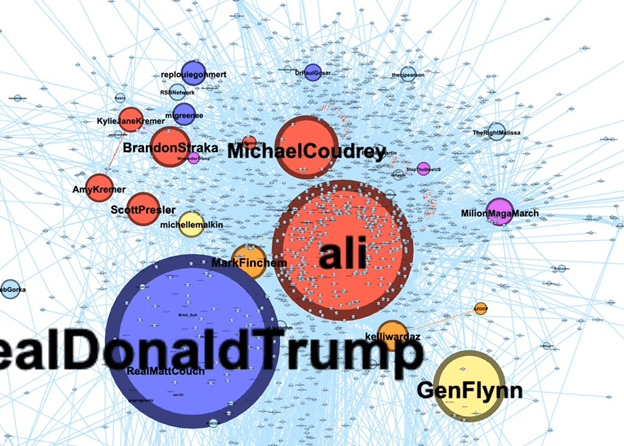
- These graphs can be misleading, so a little context. This shows a three part structure. The top includes the now suspended account of former Pres. Trump as well as many of the organizers of the Stop the Steal movement. (Zooming into the top.)
- Bottom section is a second component that we often see in network graphs of US right-wing discourse. It’s a lot of “grassroots” activist accounts (a bit of astroturf as well) that have build connections over years thru follow-backs and other techniques — and often RT each other.
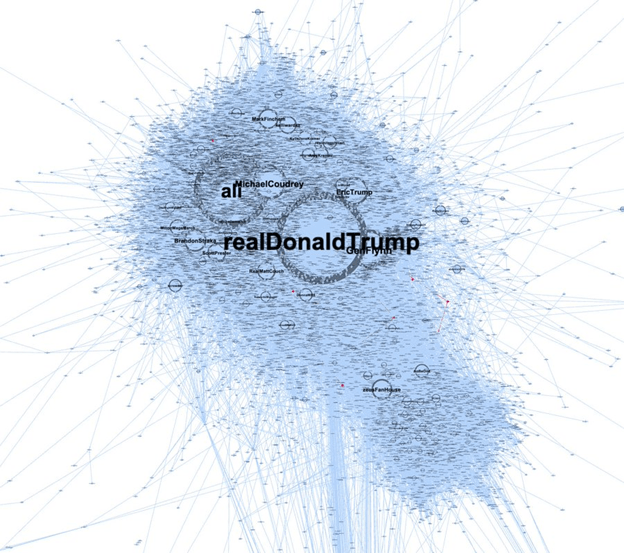
- If we lower the RT threshold on for the edges (to 3 retweets) we can see the larger audiences cluster around the influencers and, to a lesser extent, spread around the second network component as well.

